Climate change and extreme events: are they two sides of the same coin?
At the start of the new year, the Iberian Peninsula and the south of France were hit by an extraordinary storm of cold and snow, unprecedented in some territories. Heavy snowfalls, with accumulations of more than 50 cm of snow in two days, have kept much of the centre and east of the peninsula as well as the south of France on alert for this extreme weather event.
In the Pyrenees, we have reached a historical record of temperatures this time because of the cold, with the thermometers of the Clot del Tuc de la Llança weather station (Pallars Sobirá, Lleida) reaching -34ºC on the night of the Three Wise Men.
But can we say that we are facing a cold wave?
Although there is no single agreed definition of what a cold spell is, according to the State Meteorological Agency, it is an episode of abnormally low temperatures, which persist for several days and affect a significant part of a given territory. In studies by the same agency, these cold episodes have been considered extreme weather events when "for 3 consecutive days, at least 10% of the stations considered record minimums below the 5% percentile of their daily minimum temperature series for the months of January and February" with respect to a given reference period.
Although the statistical data relating to the records observed have not yet been published by AEMET and METEOFRANCE, and will certainly need to be analysed in detail, everything seems to indicate that this is the case.
Are extreme weather events, like this one, more frequent than before?
As soon as we talk about comparing frequencies and identifying trends, it is important to clarify the difference between meteorology and climatology. Meteorology is the branch of climate science that studies the transient atmospheric conditions at a given time. If we use a domestic simile, we would say that meteorology is the science that studies the mood of a child on a given day, at a given time. From this perspective, the cold and snowy storm that has accompanied the Filomena squall is explained as a conjunction of two very specific meteorological situations: a humid squall of tropical origin from the Gulf of Cadiz that has collided with the masses of very cold air from an anticyclone in the Atlantic, which has been injecting cold, dry, polar air into the peninsula for days. As this mass of cold air has been maintained during the entrance of the storm, Filomena has come across very cold soils that have quickly transformed their humidity into abundant snowfall and the persistence of the cold air has also caused it to persist and transform into ice.
On the other hand, in order to know if this situation obeys some pattern, or presents a certain cyclical behavior over time, it is necessary to resort to climatology, which could be summarized as the science that works on the analysis and study of the permanent or usual atmospheric conditions of a certain geographical area. In other words, and following the previous metaphor, we would be talking about the study of the child's personality. It is from this earth science and not from meteorology that we can obtain more or less robust answers as to whether these and other extreme weather phenomena could be increasing in frequency and intensity due to climate change.
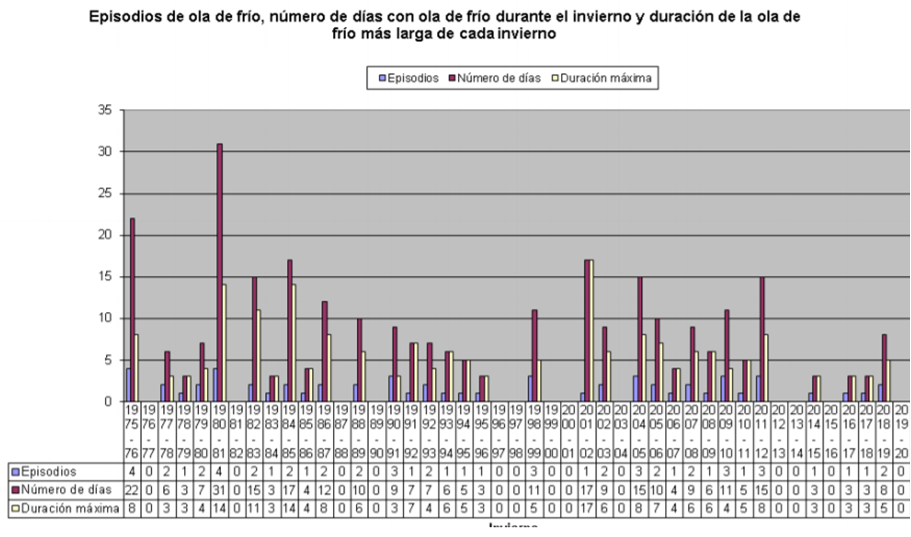
In this regard, AEMET updated in 2020 a study entitled "Cold Waves in Spain since 1975- National Climate Data Bank Service-". This report has made it possible to document how, beyond subjective perceptions and the moment, these episodes have been decreasing both in number and in duration over the last 45 years (figure 1): while in the period 1976-1990, the number of cold waves in Spain was 23, in the following fifteen years (1991-2005) the figure dropped to 20; and, finally, in the last three five-year periods (2006-2020) only 16 episodes were counted.
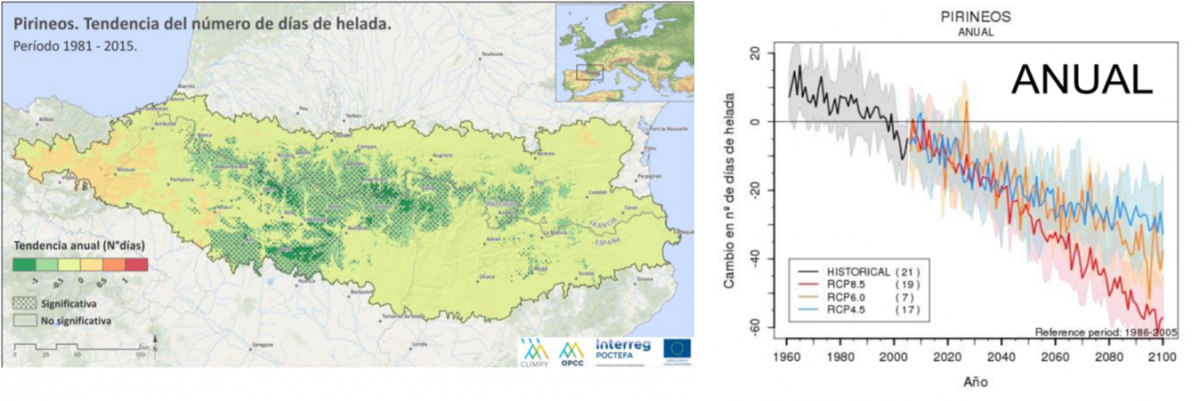
However, it could be said that the Achilles' heel of weather is that very long and/or very homogeneous data series are needed to identify robust and reliable trends. On the one hand, we have few historical series of extreme events because these are rare by definition, which means that there is less data available to analyse their evolution. On the other hand, there is less coverage of measuring stations in certain areas of the territory such as mountains (especially at heights above 1,500 metres), which leads to a "vacuum" of data in certain areas, at certain heights and for certain variables. This generates biases in the analyses, especially when we are talking about snow data. In this sense, the OPCC has been working, in collaboration with the University of Zaragoza, the State and Regional Meteorological Agencies of Spain, France and Andorra and other scientific bodies, for a decade now to improve the climate databases needed to give greater robustness to the study of the climate in the Pyrenees, also going beyond administrative borders.
Is climate change affecting extreme weather events?
Although it cannot be claimed that Filomena is a direct or exclusive consequence of the global climate crisis, it has been widely demonstrated by the international scientific community that when the average temperature of the earth increases (or decreases) from any cause, extreme weather events experience changes in their behaviour on a global scale.
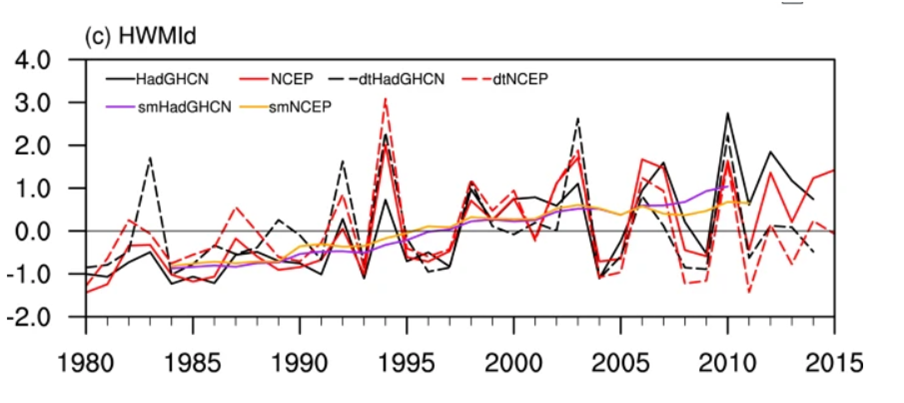
In the absence of more robust data, in the case of cold waves we can say that the trend in Spain seems to be downwards. In contrast, it is worth remembering that heat waves, which are much more lethal, show a significant trend towards greater frequency and magnitude throughout the Mediterranean basin (Figure 3).
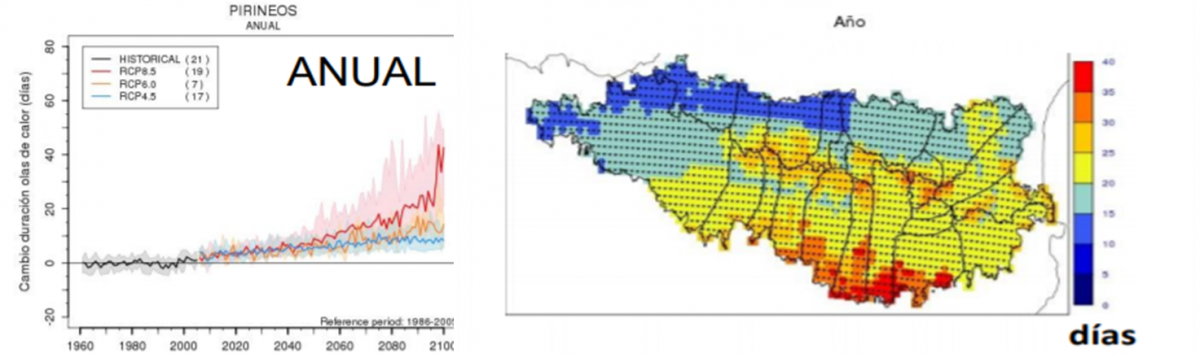
According to the preliminary studies carried out by the CLIMPY project (Interreg- Poctefa) in relation to temperature extremes, it is highly likely that this trend will also be confirmed in the Pyrenees over the next few decades, where the main models predict increases of up to 40 days in hot spells, especially intense on the southern slopes of the mountain range (Figure 4).
Prestigious studies have estimated that about 75% of the current extremes of heat observed on land are directly attributable to human action (Fischer and Knutti, 2015). Extreme precipitation events also appear to have increased significantly since 1980 and this increase is consistent with the rise in global average temperatures (Lehmann et al., 2015).
The scientific evidence is becoming increasingly robust. There is every indication that both changes in global average temperature values and changes in the behaviour of weather extremes are a direct consequence of anthropogenic climate change (IPCC. 2015; EEA. 2016).
Therefore, in order to talk about climate change, we must not be influenced by the subjective perception of an exceptionally cold winter, we must continue to study trends and variations on historical patterns. Climate change entails great contrasts, not forgetting that 2020 was the warmest year ever recorded, followed closely by 2015, 2016, 2017 and 2018 (Copernicus, 2020 y OMM. 2019).


PYRENEAN CLIMATE CHANGE OBSERVATORY
Avenida Nuestra Señora de la Victoria, 8
22.700 - Jaca
Huesca - España
+34 974 36 31 00
info_opcc@ctp.org